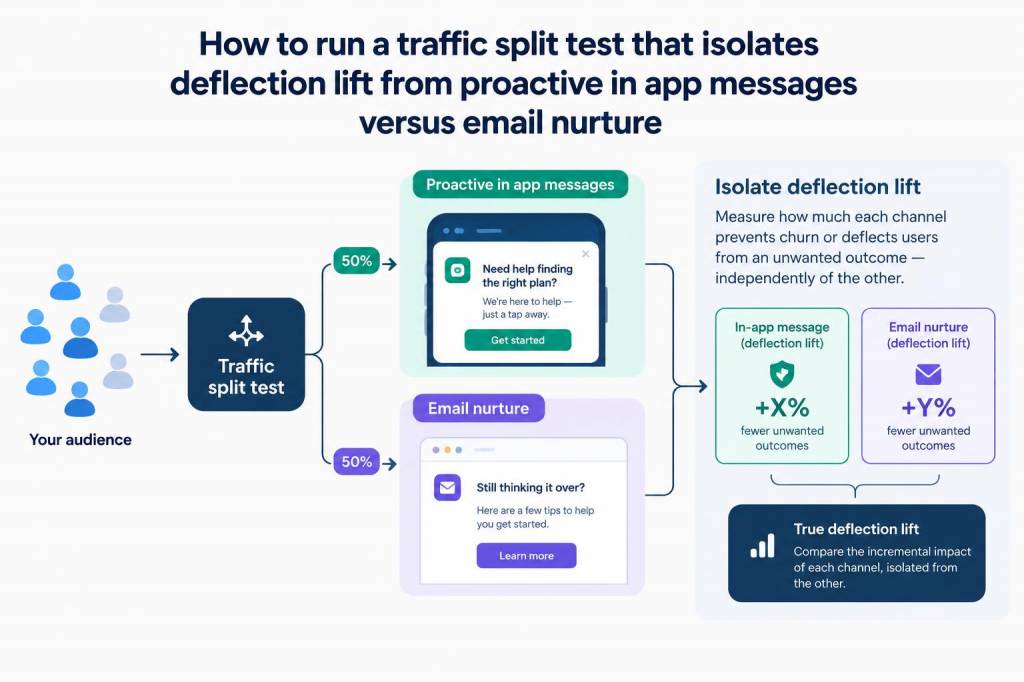
When I help teams measure the true impact of proactive channels—like in-app messages versus email nurture—the trickiest challenge is isolating deflection lift. In plain terms: how many support contacts did you avoid because you reached customers proactively, rather than because of general product improvements, seasonality, or customers who would have self-served anyway? I’ve run this experiment enough times to know it’s easy to draw the wrong conclusion unless you plan carefully.
Why a dedicated traffic-split test matters
Most teams compare “before vs after” or run a simple A/B where Group A sees an in-app message and Group B receives an email. Those approaches can be misleading. They don’t fully account for cross-channel contamination (someone getting both messages), channel timing differences (in-app gets immediate attention; email may be read later), or differing intents among recipients. A well-designed traffic-split test isolates the incremental deflection each channel delivers, so you can make confident investment decisions.
Core idea: orthogonal splits with exclusion windows
My preferred design is a traffic-split that creates mutually exclusive exposure groups plus a control, and enforces time-based exclusion windows to prevent overlap. At a high level:
Make the exclusion windows long enough to capture channel effects but short enough to retain business relevance (I often use 7–14 days depending on typical contact latency).
Define the primary outcome and supporting metrics
Be precise about what “deflection” means for your organisation. I typically use:
Instrument everything so you can segment by intent: contact channel (chat, email, phone), topic using ticket classification, and whether the contact was resolved with a self-serve article or required agent intervention.
Randomisation and bucketing strategy
Randomise at the user or account level depending on your product. For B2B situations, randomise at the account level to avoid leakage across users. Use deterministic hashing on a stable ID (user_id or account_id) so routing logic in your in-app messaging system, email platform, and analytics all align.
Example approach:
This ensures consistent assignment across touchpoints and retargeting attempts.
Attribution windows and exclusion logic
Channel timing matters. In-app messages are seen immediately; emails have variable open rates. I recommend:
For longer-running campaigns (e.g., multi-email nurture), consider a rolling attribution window or survival analysis to capture delayed effects.
Power calculations and sample size
Don’t guess sample size. A low-impact channel (2–5% relative reduction in contacts) requires large samples to detect. I plug numbers into power calculators using baseline contact rate, minimum detectable effect (MDE), alpha (usually 0.05), and power (0.8). Practical rules of thumb:
If you’re unsure, start with a pilot to estimate variance and baseline rates, then scale the test.
Instrumentation checklist
Before you flip the switch, ensure you have:
Common gotcha: forgotten caching layers that prevent the latest bucket from being read—test the full delivery path.
Analysis approach
I use a blend of simple and robust techniques:
Important: report both relative and absolute changes. A 20% relative reduction sounds big, but if baseline contacts are 0.5% of users, the absolute lift is 0.1 percentage points—translate that to tickets avoided per 10k users so stakeholders grasp impact.
Handling contamination and overlapping experiments
Overlap with other experiments is the bane of reliable measurement. To minimise contamination:
If you still see contamination, consider running a holdout control longer to observe baseline drift.
Practical example
At one SaaS company, we wanted to compare a contextual in-app troubleshooting card against a three-email nurture sequence for a common billing question. We randomized 100k accounts into Control (25k), In-app (25k), Email (25k), Both (25k). We used a 14-day attribution window and blocked email sends for In-app users during that window. After 21 days we observed:
| Bucket | Contact rate (14d) | Relative change vs Control |
|---|---|---|
| Control | 4.0% | - |
| In-app | 2.9% | -27.5% |
| 3.6% | -10.0% | |
| Both | 2.7% | -32.5% |
We ran a Poisson regression adjusting for account size and region and found the in-app card delivered a statistically significant deflection vs email. Importantly, CSAT on the small subset who still contacted support didn’t decline, which de-risked the channel shift.
What I watch for after the test
After you’ve established deflection lift, monitor downstream effects for a few weeks: ticket quality, repeat contacts, and revenue-related metrics. Sometimes proactive messaging deflects high-value issues in ways that lower LTV or increase churn risk—watch for those signals.
Running a clean, honest traffic-split test takes discipline: deterministic randomisation, strict exclusion windows, careful instrumentation, and thoughtful analysis. When you get this right, you don’t just know which channel reduces contacts—you know which channel reduces the right contacts, at the right time, without creating unintended harm.