When I run pilots for new automation—especially AI that interacts directly with customers—I want one thing above all: clear, defensible evidence that the tech improves outcomes people care about. Recently I built a seven-day experiment to prove a GPT-powered assistant could reduce reopen rates without hurting CSAT. Below I’ll walk you through the exact design I used, why each step matters, and practical tips so you can run this in your own support org next week.
Why a seven-day experiment?
Seven days hits a sweet spot for many operational teams: short enough to iterate quickly and long enough to gather meaningful signal on reopen behaviour and CSAT. Reopens often show up within a few days of case closure, and CSAT feedback typically arrives in that same window. A week balances speed and statistical power while keeping the project manageable for stakeholders.
What I’m trying to prove (and what I’m not)
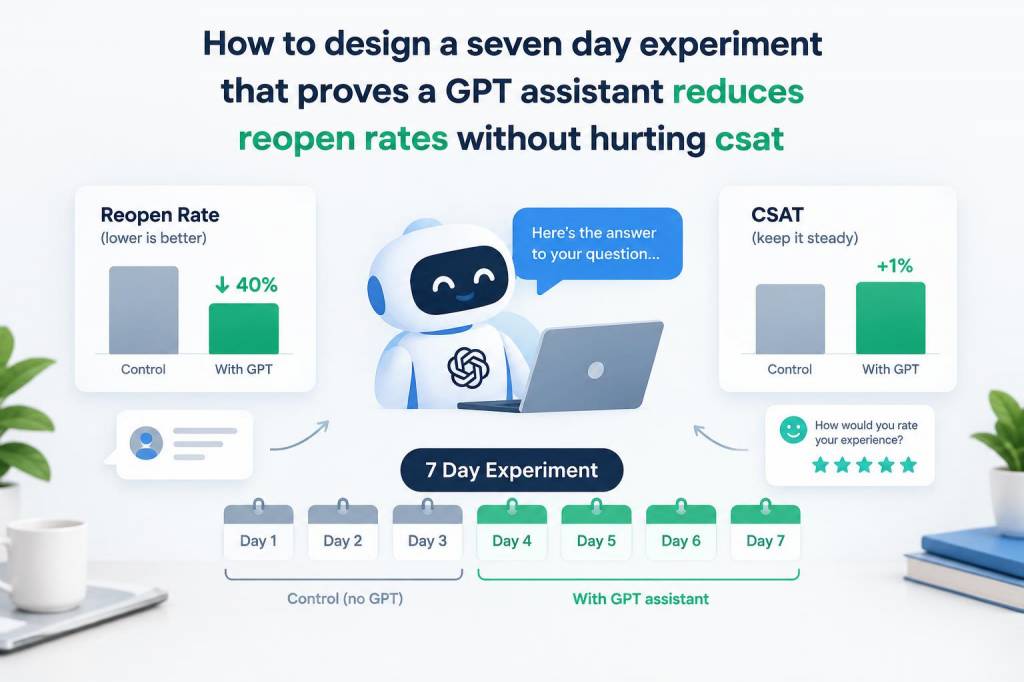
My hypothesis was simple: introducing a GPT assistant into agent workflows will reduce ticket reopen rates by X% and maintain (not reduce) CSAT scores. I wasn’t trying to prove the assistant makes agents faster or customers happier in every way—just that it reduces repeat contacts without harming satisfaction. That’s a focused, business-relevant claim that’s easy to measure.
Key metrics
- Reopen rate: percentage of resolved tickets that are reopened within 3 days and within 7 days.
- CSAT: average customer satisfaction rating (1–5 or NPS-style) collected after resolution.
- Resolution quality flags: qualitative markers like “requires escalation” or “knowledge gap” captured by agents.
- Agent override rate: how often agents edit or discard assistant output (proxy for trust and accuracy).
- Time to resolution (optional): for context, though not central to this experiment.
Experiment design
I used an A/B randomized controlled design with two cohorts: Control (human-only) and Treatment (GPT assistant suggested responses). Randomization happens at the agent-session level to avoid customer-level leakage—if a customer interacts with multiple agents there’s some risk, but for a seven-day window and with volume balancing, agent-session randomization is pragmatic and commonly used.
- Population: Tickets for Tier 1 and Tier 2 support, excluding legal/finance/complex SLA cases. This removes outliers that could skew reopen behaviour.
- Sample size target: Minimum of 200 resolved tickets per arm across the week. With typical reopen rates of 10–20%, this gives enough reopen events to detect meaningful change; if your volume is higher, power increases.
- Randomization: Randomly assign new ticket sessions to Control or Treatment at creation. Use a consistent random seed so you can reproduce assignment.
- Blinding: Agents know if they’re using an assistant (operationally necessary). Customers are blind.
Assistant configuration and guardrails
How you configure the GPT assistant matters more than the underlying model. I recommend:
- Few-shot prompts: Provide the assistant with 3–5 high-quality examples of ideal responses for common issues. That anchors tone and level of detail.
- Response template: Use a short, customer-facing paragraph plus an “internal notes” succinct summary for agents to copy into the ticket.
- Safety filters: Block hallucinations by adding a prompt instruction to cite knowledge base articles or say “I don’t know” for facts outside the KB.
- Confidence estimate: Surface a confidence score or a “high/medium/low” flag so agents know when to scrutinize output.
- Human-in-the-loop: Make agent edits easy and capture override reasons in structured fields.
Operational steps — day by day
- Day 0 (prep): Configure routing, prompts, logging. Train agents for 30–45 minutes on using the assistant, how to override, and why the experiment matters.
- Day 1–7 (run): Live traffic flows. Agents in Treatment use the assistant for suggested replies; Control agents use current workflows. Encourage agents to mark forks: “accepted”, “edited”, or “rejected” for each suggestion.
- Daily monitoring: Check volume balance, basic quality flags, and any CSAT anomalies. If the model produces harmful suggestions, pause immediately.
- Post-day 7 (analysis): Pull metrics, join with reopen events, and compare cohorts.
Data schema and dashboard
Ensure you capture these fields for each ticket:
| ticket_id | arm (Control/Treatment) |
| created_at | resolved_at |
| reopened_within_3d | reopened_within_7d |
| csat_score | agent_override (accepted/edited/rejected) |
| kb_references | escalation_flag |
I built a small dashboard showing daily counts, reopen rates by arm, average CSAT by arm, and override rates. Visualizing trends during the week helps detect drift or sudden problems.
Statistical approach
For reopen rate (binary outcome): use a two-proportion z-test to compare Treatment vs Control reopen percentages at 3 and 7 days. For CSAT (ordinal but often treated as interval), I run a t-test on mean CSAT and also check median differences with a Mann–Whitney U test as a robustness check. I always report 95% confidence intervals and effect sizes, not just p-values.
Interpreting results
Outcomes fall into a few practical buckets:
- Lower reopen rate, no CSAT decline: Win. The assistant reduced repeat contacts without harming satisfaction—ready to expand to more agents and channels.
- Lower reopen rate, lower CSAT: Mixed. Investigate whether tone or accuracy caused dissatisfaction. Look at override reasons and qualitative CSAT comments.
- No change in reopen rate, no CSAT change: Neutral—possibly the assistant didn’t materially change resolution quality. Iterate prompts or expand scope.
- Higher reopen rate or lower CSAT: Fail-fast. Pause, analyze failure modes (hallucinations, incorrect KB links, bad tone) and fix before wider rollout.
Common pitfalls and fixes
- Low sample size: If weekly volume is low, extend the experiment or pool multiple weeks. Underpowered tests produce inconclusive results.
- Leakage between arms: Agents talking across arms or copying templates can blur differences. Use training and short-term incentives to respect arm boundaries.
- Model drift: If you change prompts or model mid-week, you invalidate the experiment. Lock config during the run.
- Overreliance on averages: A small number of large escalations or outliers can distort means—always look at distributions and qualitative logs.
Example quick prompt (starter)
Here’s a concise prompt I used as a starting point. You’ll want to adapt it to your KB and tone.
“You are a support assistant for [Brand]. Read the customer message and our KB articles. Produce a polite, concise customer-facing reply (2–4 short paragraphs), include 1–2 KB links as references, and provide a 1-sentence internal summary for the ticket. If the answer requires policy or escalation, say ‘Please escalate’ rather than inventing details.”
Running this seven-day experiment taught me two things: first, focused metrics (reopen + CSAT) win stakeholder buy-in faster than sprawling KPIs; second, human-in-the-loop and clear override tracking are non-negotiable. If you set up data capture correctly and lock your implementation for the test window, you’ll have evidence you can trust—whether that evidence supports expansion or signals important fixes to make first.